教師あり学習アルゴリズム
pandas とか matplotlib とか色々弄っていく。
インプットはコレ

Pythonではじめる機械学習 ―scikit-learnで学ぶ特徴量エンジニアリングと機械学習の基礎
- 作者: Andreas C. Muller,Sarah Guido,中田秀基
- 出版社/メーカー: オライリージャパン
- 発売日: 2017/05/25
- メディア: 単行本(ソフトカバー)
- この商品を含むブログ (1件) を見る
全部は書かない。
先ずは必要なライブラリのインポート
Python で始める機械学習 という本の第二章先頭なのだけど、いきなり暗黙 import じみた事やってて初見殺しにも程があんだろ(汗
%matplotlib inline
from IPython.display import set_matplotlib_formats, display
import pandas as pd
import numpy as np
import matplotlib.pyplot as plt
import mglearn
データの種類別散布図
で、改めてデータロード
X, y = mglearn.datasets.make_forge()
print(f"X.shape: {X.shape}")
X.shape: (26, 2)
そしてグラフ化
ちなみに、mglearn.discrete_scatter は、どうも pyplot の scartter を第3引数のデータごとに記号を変えて呼び出してくれるものらしい。
参考: テラテイルでの質問
mglearn.discrete_scatter(X[:, 0], X[:, 1], y)

plt.legend(["Class 0", "Class 1"], loc=4)
plt.xlabel("First feature")
plt.ylabel("Second feature")
Text(0, 0.5, 'Second feature')
[f:id:white-azalea:20190318232637p:plain]
それぞれのデータの中身を見ていく。
y はデータの種類を表して
y
array([1, 0, 1, 0, 0, 1, 1, 0, 1, 1, 1, 1, 0, 0, 1, 1, 1, 0, 0, 1, 0, 0,
       0, 0, 1, 0])
X は、その座標を示してる。
こっちは x, y 座標のペアだ。
X
array([[ 9.96346605, 4.59676542], [11.0329545 , -0.16816717], [11.54155807, 5.21116083], [ 8.69289001, 1.54322016], [ 8.1062269 , 4.28695977], 中略 [11.563957 , 1.3389402 ]])
もっと他にも散布図
wave データセットというらしい。
他の散布図も作画してみる。
単純に x, y の配列だけを指定すると、データ分類のないシンプルな散布図ができる。
X, y = mglearn.datasets.make_wave(n_samples = 40)

plt.plot(X, y, 'o')
plt.ylim(-3, 3)
plt.xlabel('Feature')
plt.ylabel('Target')
Text(0, 0.5, 'Target')
[f:id:white-azalea:20190318232752p:plain]
y
array([-0.44822073,  0.33122576,  0.77932073,  0.03497884, -1.38773632,
       -2.47196233, -1.52730805,  1.49417157,  1.00032374,  0.22956153,
       -1.05979555,  0.7789638 ,  0.75418806, -1.51369739, -1.67303415,
       -0.90496988,  0.08448544, -0.52734666, -0.54114599, -0.3409073 ,
        0.21778193, -1.12469096,  0.37299129,  0.09756349, -0.98618122,
        0.96695428, -1.13455014,  0.69798591,  0.43655826, -0.95652133,
        0.03527881, -2.08581717, -0.47411033,  1.53708251,  0.86893293,
        1.87664889,  0.0945257 , -1.41502356,  0.25438895,  0.09398858])
X
array([[-0.75275929],
       [ 2.70428584],
       [ 1.39196365],
       [ 0.59195091],
       [-2.06388816],
       [-2.06403288],
       [-2.65149833],
       [ 2.19705687],
       [ 0.60669007],
       [ 1.24843547],
       /* 中略 */
       [ 1.10539816],
       [-0.35908504]])
乳癌データセット
恐ろしいなまえだなおい…マジか O'Reily 先生よ
from sklearn.datasets import load_breast_cancer
cancer = load_breast_cancer()
print(f"Cancer keys: {cancer.keys()}")
Cancer keys: dict_keys(['data', 'target', 'target_names', 'DESCR', 'feature_names', 'filename'])
cancer.data.shape
(569, 30)
[f'{n}: {v}' for n, v in zip(cancer.target_names, np.bincount(cancer.target))]
['malignant: 212', 'benign: 357']
cancer.feature_names
array(['mean radius', 'mean texture', 'mean perimeter', 'mean area',
       'mean smoothness', 'mean compactness', 'mean concavity',
       'mean concave points', 'mean symmetry', 'mean fractal dimension',
       'radius error', 'texture error', 'perimeter error', 'area error',
       'smoothness error', 'compactness error', 'concavity error',
       'concave points error', 'symmetry error',
       'fractal dimension error', 'worst radius', 'worst texture',
       'worst perimeter', 'worst area', 'worst smoothness',
       'worst compactness', 'worst concavity', 'worst concave points',
       'worst symmetry', 'worst fractal dimension'], dtype='<U23')
ボストンデータセット
1970 年代のボストン郊外の住宅価格の中央値、犯罪率、チャールズ川からの距離、高速道路への利便性。
from sklearn.datasets import load_boston

boston = load_boston()
boston.data.shape
(506, 13)
さらにこのデータをオライリー先生は拡張し、特徴量を 104 まで増やしたデータセットを作ったという。
13 の 2 組み合わせで、重複ありの 91 種類が追加されてるらしい。
X, y = mglearn.datasets.load_extended_boston()
X.shape
(506, 104)
K-NN アルゴリズム
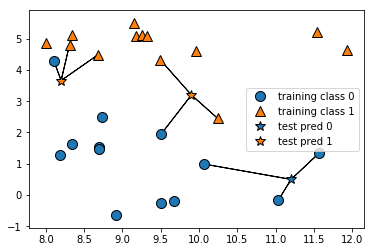
これは不明なデータ(図では ☆)を、そこから「最も近いデータと多分同じ仲間なのだろう」とか、その捜索範囲で近い点 N 個の平均で、「多分○○の仲間なのだろう」という様な推測をするアルゴリズム。
直近1個で決めるとこんな感じ。
尚、星の分類は色で示してる。
mglearn.plots.plot_knn_classification(n_neighbors=1)

これを直近3点で考えた時の分類。
mglearn.plots.plot_knn_classification(n_neighbors=3)

この様なアルゴリズムを scikit-learn でやってみる。
先ずはデータの読み込みと、学習/試験データへの分離。
from sklearn.model_selection import train_test_split

X, y = mglearn.datasets.make_forge()

X_train, X_test, y_train, y_test = train_test_split(X, y, random_state = 0)
そして、K 近傍法アルゴリズムの設定と学習。
from sklearn.neighbors import KNeighborsClassifier

clf = KNeighborsClassifier(n_neighbors=3)
clf.fit(X_train, y_train)
KNeighborsClassifier(algorithm='auto', leaf_size=30, metric='minkowski',
           metric_params=None, n_jobs=None, n_neighbors=3, p=2,
           weights='uniform')
さて、正答率は?
clf.score(X_test, y_test)
0.8571428571428571
K-近傍法の解析
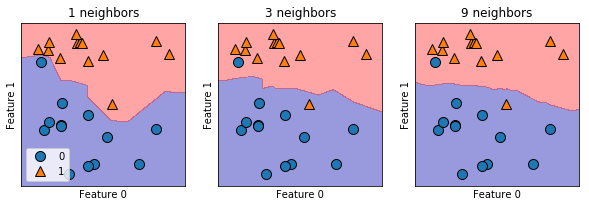
学習した K-近傍法が、どの様な決定境界(ここを超えたら赤と認識する様な境界の事)を持つのかを見てみる。
ちなみに説明すると、subplots で 1 エリア 3 つのグラフ作成。
fig: Figure 図の意味。axes: AxesSubplot(s) サブグラフリストの意味。
個人的にわからなくて調べた範囲だと、
- plot_2d_separator
これもやはり画面表示のヘルプらしい。二次元で境界線を作って作画してくれるようだ。 - discrete_scatter
第一引数 x 座標、第二引数 y 座標、第3引数 分類、ax 引数 作画対象の表を指定して、種類と色別に作画してくれるライブラリ。
fig, axes = plt.subplots(1, 3, figsize=(10, 3))

for n_neighbors, ax in zip([1, 3, 9], axes):
    clf = KNeighborsClassifier(n_neighbors=n_neighbors).fit(X, y)

    mglearn.plots.plot_2d_separator(clf, X, fill=True, eps=0.5, ax=ax, alpha=0.4)
    mglearn.discrete_scatter(X[:, 0], X[:, 1], y, ax = ax)
    ax.set_title(f'{n_neighbors} neighbors')
    ax.set_xlabel('Feature 0')
    ax.set_ylabel('Feature 1')

axes[0].legend(loc=3)

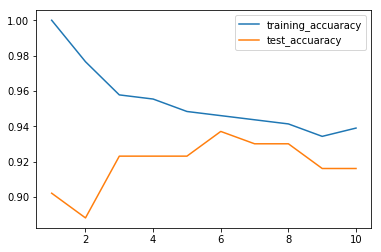
じゃぁどの程度丸めるのがいいのかについて試してみる。
近傍の数をある程度の範囲で操作しつつ、トレーニングデータの一致率と、テストデータの一致率をそれぞれ確認する。
from sklearn.datasets import load_breast_cancer

# 乳癌データで試してみる。
cancer = load_breast_cancer()
X_train, X_test, y_train, y_test = train_test_split(cancer.data, cancer.target, stratify=cancer.target, random_state=66)

# 精度記録
training_accuaracy = []
test_accuaracy = []

# n_naighbors を 1 から 10 まで試す
neighbors_settings = range(1, 11)

for n_neighbors in neighbors_settings:

    # 学習機作って学習させて
    clf = KNeighborsClassifier(n_neighbors=n_neighbors)
    clf.fit(X_train, y_train)

    # 訓練セットの精度を記録する
    training_accuaracy.append(clf.score(X_train, y_train))

    # 汎化精度を記録
    test_accuaracy.append(clf.score(X_test, y_test))

# プロットしてみる
plt.plot(neighbors_settings, training_accuaracy, label='training_accuaracy')
plt.plot(neighbors_settings, test_accuaracy, label='test_accuaracy')
plt.legend()
plt.show()

K 近傍の数が増えるに連れて、個々のデータをみる様な事がなくなるので、およそ傾向的に判断する様になる。
一方で、学習データだけでみると、バースト値に惑わされなくなる分、精度が下がっていく傾向が出る。
でもじゃぁどの位の値がベストなのかは、正直このグラフを見てみるまでわからない気がする。
数字をあげすぎても未知だったデータに対しての正答率が下がるので、上げ過ぎもよくないようだ。
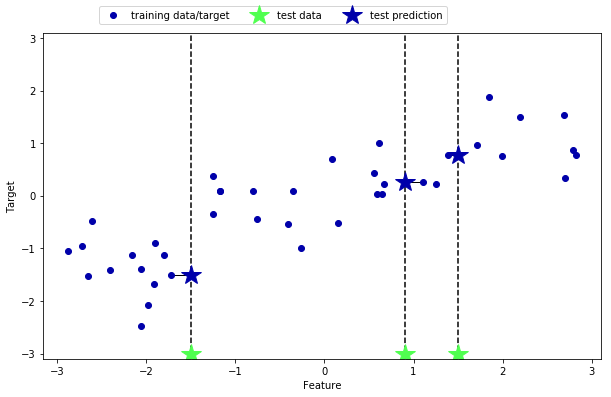
K-近傍回帰
K-近傍法で、回帰を行う変種を使ってみる。
mglearn.plots.plot_knn_regression(n_neighbors=1)

mglearn.plots.plot_knn_regression(n_neighbors=3)

図で見て理解したわ、これ K 平均法によく似てる。
from sklearn.neighbors import KNeighborsRegressor
X, y = mglearn.datasets.make_wave(n_samples = 40)

X_train, X_test, y_train, y_test = train_test_split(X, y, random_state=0)

reg = KNeighborsRegressor(n_neighbors=3)
reg.fit(X_train, y_train)
KNeighborsRegressor(algorithm='auto', leaf_size=30, metric='minkowski',
          metric_params=None, n_jobs=None, n_neighbors=3, p=2,
          weights='uniform')
じゃーこの回帰で処理するとどれくらいの数字が出るのか?
reg.score(X_test, y_test)
0.8344172446249604